Chisq distributions
distribution
The Chi squared distribution with some integer degrees of freedom is the sum of squares of independent standard Normal variates.
using Distributions
using Plots
gr()
using SpecialFunctions
using LaTeXStrings
@doc ChisqPrepare standard normal distributions
d = Normal(0,1)Plot histogram
sample = rand(d, 10000)
p = plot(xlim=[-3, 3])
histogram!(sample, normalize=:pdf, label="hist")
plot!(x->pdf(d, x),label="pdf")
savefig(joinpath(@OUTPUT, "normal.png"))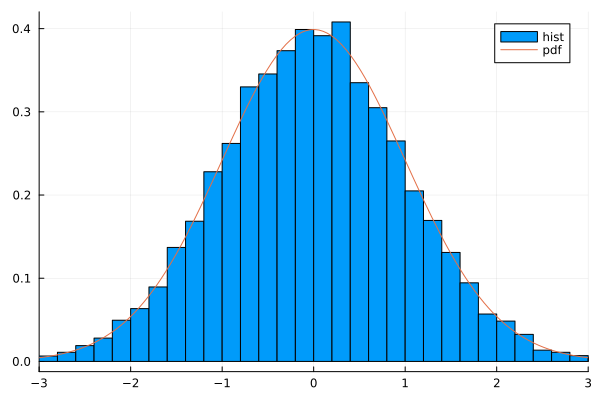
Prepare function
@doc gammaΓ(x) = gamma(x);function T(n, z)
if z > 0
a = z^(n/2 - 1)*exp(-z/2)
b = 2^(n/2) * Γ(n/2)
return a/b
else
return 0.
end
end;Generate distribution with ...
degree = 1
n_trial = 100000
X = rand(d, n_trial)
X² = X .^ 2.
p = plot()
histogram!(p, X², normalize=:pdf, label=L"X^2")
x = range(0.01,2,length=100)
y = T.(1, x)
plot!(p, x, y, xlim=[0,2], ylim=[0,4], label=L"T_1")

y = pdf.(Chisq(1), x)
plot!(p, x, y, line=:dash, label=L"\chi^2(1)") ;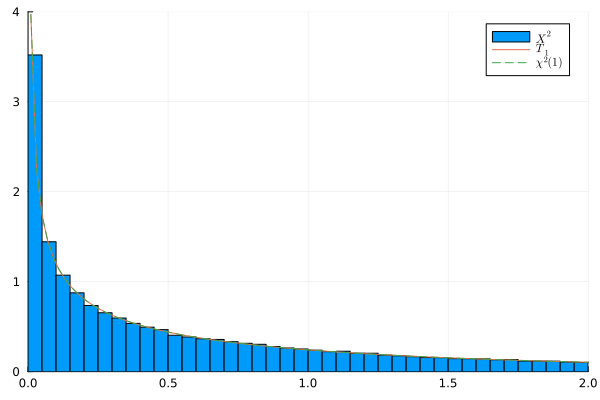
degree = 2
n_trial = 100000
X = rand(d, n_trial)
Y = rand(d, n_trial)
X² = X .^ 2
Y² = Y .^ 2
p=plot()

histogram!(p, X².+Y², normalize=:pdf, label=L"X^2+Y^2")
x = range(0.01,2,length=100)
y = T.(2, x)
plot!(p, x, y,xlim=[0,5], ylim=[0,0.5], label=L"T_3")

χ² = Chisq(2)

y = pdf.(χ², x)
χ² = Chisq(2)
plot!(p, x, y, label=L"\chi^2(2)",line=:dash)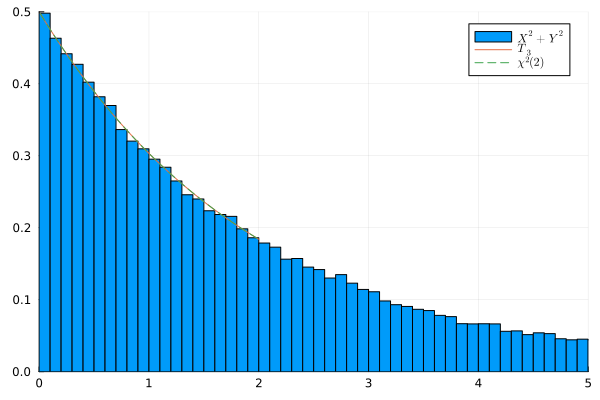
degree = 3
n_trial = 100000
X = rand(d, n_trial)
Y = rand(d, n_trial)
Z = rand(d, n_trial)
X² = X .^ 2
Y² = Y .^ 2
Z² = Z .^ 2
p = plot()
histogram!(p, X².+Y².+Z², normalize=:pdf, label=L"X^2+Y^2+Z^2")
χ² = Chisq(3)

x = range(0.01,2,length=100)
y = T.(3, x)
plot!(p, x, y,xlim=[0,5], ylim=[0,0.5], label=L"T_3")
y = pdf.(χ², x)

plot!(p, x, y, label=L"\chi^2(3)",line=:dash)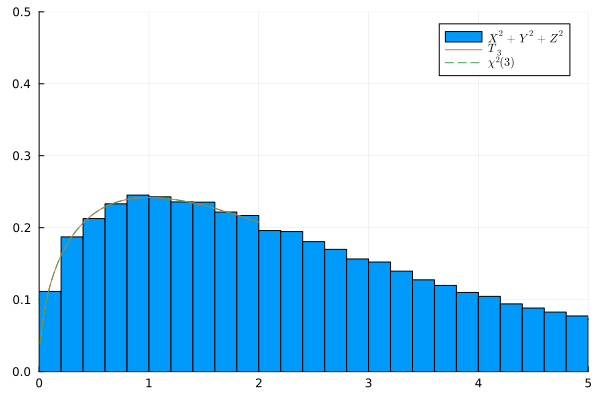
© SatoshiTerasaki. Last modified: 2022年12月17日 土曜日. Website built with
MathSeminar.jl
Franklin.jl.